Introduction
As websites and web applications become more complex, it is necessary to measure and track their overall quality to provide a seamless browsing experience to your clients. Though several other tools exist for this purpose, Google lighthouse is quite popular among web developers mainly because it is part of the Chrome DevTools.
If it doesn't meet your needs as part of Chrome DevTools, Google lighthouse is also readily available as a Node package or command line utility. You can use it for auditing a website for performance, best practices, accessibility, progressive web app (PWA), and search engine optimization(SEO).
You will explore the different ways of using Google Lighthouse in this article. You will also learn how to remedy some of the issues highlighted in the performance measurement and use Google lighthouse in continuous integration(CI) workflow.
Step we'll cover:
- What is Google Lighthouse
- How to use Google lighthouse from Chrome DevTools
- How to use Google lighthouse Node CLI
- How to use Google lighthouse Node module
- How to use Google Lighthouse Chrome browser extension
- How to use Google lighthouse for auditing progressive web apps
- How to view Google lighthouse report
- How to add Google lighthouse to a CI workflow
Prerequisites
Depending on how you intend to use Google lighthouse, you need to have some or all of the following tools.
- Node version 14 or higher. Download Node for your system if you haven't.
- Chrome browser. Download Chrome for your system if you haven't.
What is Google Lighthouse
Google Lighthouse is an open-source, Apache-licensed tool developed and maintained by Google. It is distributed primarily as part of Chrome DevTools and other Chromium-based browsers like Opera, Brave, and Edge.
You can use it for auditing a web page or browser extension primarily for performance, best practices, accessibility, PWA, and SEO. It presents the test results as percentages and goes above and beyond to provide actionable tips on fixing the identified problems in the specified categories.
Though the easiest way of using Google lighthouse is via the Chrome DevTools, you can also run it as a chrome extension, command line tool, or an NPM package. The subsequent sections will explain the different ways you can use Google Lighthouse.
How to use Google lighthouse from Chrome DevTools
Most Chromium-based browsers package Google lighthouse as part of their DevTools however, we will focus more on the Chrome DevTools in this article. Using it with other browsers should be similar, with slight variations.
Follow the steps below to start using Google lighthouse in Chrome DevTools.
Step 1 - Navigate to the site you want to audit
To use Google lighthouse in Chrome DevTools, navigate to the site you want to audit. We will use the refine landing page for illustration throughout this article.
Step 2 - Open Chrome DevTools
You can open Chrome DevTools by pressing the F12 key. Click the lighthouse tab after that.

Step 3 - Select categories to audit
As pointed out in the introduction section, you can use Google lighthouse for auditing a website for performance, accessibility, best practices, SEO, and PWA. You can select the different categories you want Google lighthouse to audit. If your site won't run as a PWA, it is unnecessary to leave the PWA category checked.
Similarly, you can choose whether Google lighthouse should emulate a mobile device or desktop when auditing your site.
Step 4 - Run the audit
You can click the Analyze page load button to start auditing the website.
Step 5 - Interpret the audit results
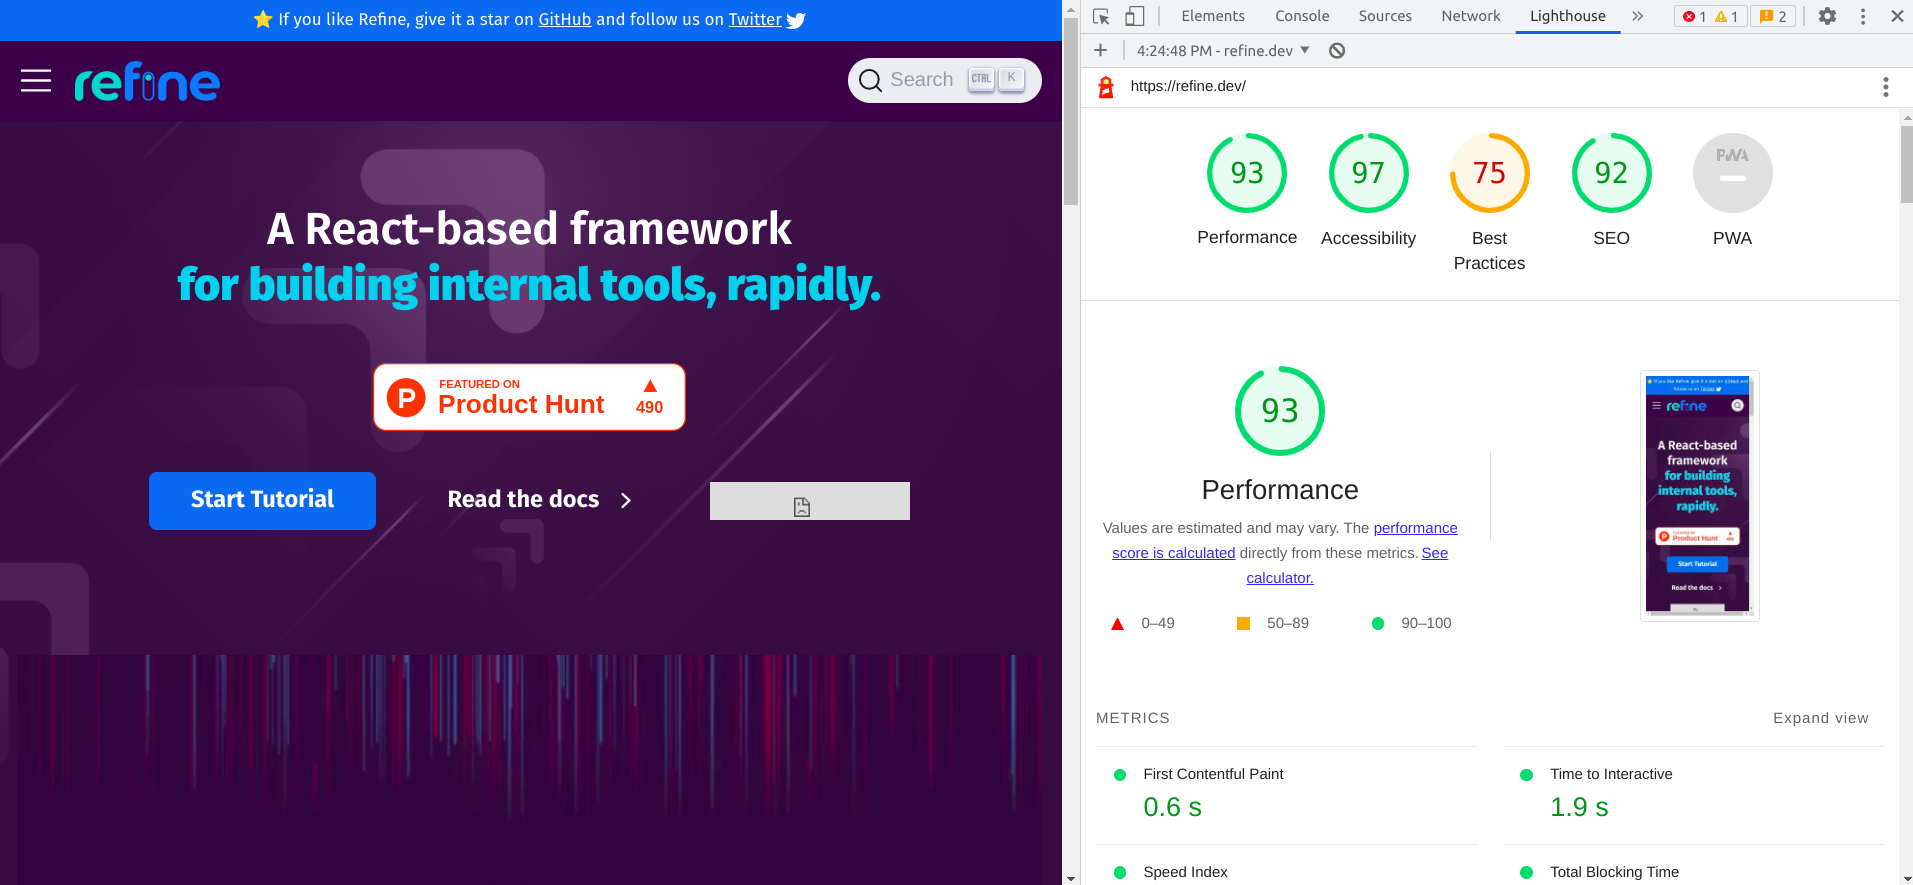
After successfully analyzing the page, Google lighthouse will present the lighthouse scores and provide suggestions on where to make improvements. The lighthouse scores for the refine landing page look like the image below.

You can copy and save the audit data in JSON format from the Tools menu.
As highlighted above, Google Lighthouse audits a web page for performance, best practices, accessibility, SEO, and PWA while simulating a mobile device or desktop. It presents the score for each category as a percentage. It will go above and beyond to explain why a test in a particular category is passing or failing. Let us have an overview of these categories in the sub-sections below.
Best practices
There are certain best practices you need to follow in Front-end development. Some of these best practices include adding doctype to the HTML element, using HTTPS, displaying images with the correct aspect ratio, and serving images with the appropriate resolution. Google Lighthouse will audit your site for some of these best practices and highlight the passing and failing tests.
Performance
Performance measurement is one of the main reasons developers use Google Lighthouse. Google Lighthouse uses the metrics below to estimate the ultimate performance score.
- First Contentful Paint - Duration, in seconds, it takes to render the first DOM content after navigating to the page.
- Time to Interactive - Amount of time, in seconds, for the page to become fully interactive.
- Speed Index - It is a measure, in seconds, of how quickly content visually displays during page load.
- Total Blocking Time - Total amount of time, in milliseconds, that a page is incapable of responding to user input like mouse clicks.
- Largest Contentful Paint - Time, in seconds, at which the browser paints the largest text or image.
- Cumulative Layout Shift - Measures the movement of visible elements within the viewport.
The final score is a weighted average of the individual scores of the above metrics. This score can help you optimize your site so users can see and interact with it. It will also highlight potential opportunities for speeding up the page load. Read the documentation for more insights on the individual metric scores and how Lighthouse calculates the final weighted score.
Accessibility
Google Lighthouse can audit your site and highlight accessibility issues like contrast ratio, input labels, and heading elements. However, it can detect only a certain percentage of accessibility issues. You need to go the extra mile and manually check some accessibility issues. A web page can have an accessibility score of 100 percent and still be inaccessible.
Progressive Web Apps
Progressives Webb Apps, better known as PWAs in short, can provide a native experience to your clients. Your PWA must be installable and should serve them from a secure origin. You can use Google lighthouse to test your PWA for some of these basic features and best practices.
Search Engine Optimization
Optimizing a website for Search Engines is inevitable in this day and age. Google Lighthouse can audit your site for SEO. Among other items, it can check whether your site has links with descriptive text and are crawlable. You can then use the test results to increase your search rankings.
It is also worth mentioning that newer versions of Google Lighthouse run in three modes (user flows). These modes are the Navigation mode, Time span mode, and Snapshot mode.
The Navigation mode analyzes a single page load and is the default. We will use the default mode throughout this article. The Time span mode analyzes for an arbitrary period, usually as the user interacts with the page. On the other hand, the Snapshot mode analyzes the page in a snapshot when the page is in a particular state.
Each mode has unique use cases, benefits, and limitations which the Lighthouse documentation articulates in great detail. Do check it out. You can select one of the other modes before analyzing if the default doesn't meet your use case.
How to use Google lighthouse Node CLI
You have the flexibility of running Google lighthouse as a command line tool. The command line tool requires you to have Node version 14 or higher. If you don't have Node, you can install it for your system from the Node downloads page.
If you have installed Node, you can install lighthouse from the NPM package registry like so:
# NPM
npm install -g lighthouse

# Yarn
yarn global add lighthouse
The code below shows the general syntax for running an audit using the command line tool. The lighthouse command requires the URL of the page you want to audit. You can also pass optional arguments to the lighthouse command.
lighthouse <url> <options>
The Google lighthouse command line tool has comprehensive documentation accessible using the command below.
lighthouse --help
The command line tool will generate the audit report and write it in an HTML file by default. You can pass optional arguments to the lighthouse command to change the default behavior. The code below will audit the refine landing page for accessibility and writes the report to a JSON file. You can view the JSON report using the lighthouse viewer.
lighthouse https://refine.dev/ --output=json --output-path=./report.json --only-categories=accessibility
You can read the documentation for more options to pass to the lighthouse command.
How to use Google lighthouse Node module
In addition to running Google Lighthouse as a command line tool, you can also run it programmatically as a Node module. You need to install Lighthouse most likely as a development dependency from the NPM package registry like so:
# NPM

npm i -D lighthouse

# Yarn

yarn add --dev lighthouse
Ordinarily, when running Lighthouse programmatically, you launch a Chrome instance before running Lighthouse, like in the example below. Below, we are launching a headless Chrome instance using the chrome-launcher package. It is a tool for launching Google Chrome with ease from Node. Check the documentation to learn how to use it. After running Lighthouse, you can save the audit data to file and terminate the Chrome instance.
For our case, Lighthouse takes the URL of the site you want to audit as its first argument. The first argument is optional if you are running Lighthouse in auditMode. The second and third arguments are also optional. If you don't pass them, Lighthouse will use the default.
const fs = require("fs");
const chromeLauncher = require("chrome-launcher");
const lighthouse = require("lighthouse");

const launchChromeAndAudit = async (url) => {
  const chrome = await chromeLauncher.launch({ chromeFlags: ["--headless"] });
  const result = await lighthouse(url, {
    output: "json",
    logLevel: "info",
    port: chrome.port,
    onlyCategories: ["accessibility"],
    screenEmulation: { mobile: true },
  });
  fs.writeFileSync(`${Date.now()}-audit-report.json`, result.report);
  chrome.kill();
};

launchChromeAndAudit("https://refine.dev/");
The code above will audit the refine landing page for accessibility and save the report to a file in JSON format. After that, you can upload the data to the lighthouse viewer to view it in the browser. Omitting the onlyCategories field will audit the site for all categories.
You can also save the audit report as an HTML file by setting the value of the output field to html instead of json, as we did in the example above. What I have provided above is a simple example. Check the documentation for more on how to run Google lighthouse programmatically.
How to use Google Lighthouse Chrome browser extension
In addition to being part of the Chrome DevTools, Google lighthouse also comes as a browser extension. The browser extension doesn't allow testing of local sites and authenticated pages. Therefore it is preferable to use Google lighthouse from Chrome DevTools instead of the browser extension.
You can install the browser extension from the Chrome web store if you have a good reason for using it. After installation, follow the steps below to audit any site using the lighthouse browser extension.
Step 1 - Navigate to the website you want to audit
Like using Google lighthouse in chrome DevTools, start by navigating to the site you want to audit. For this illustration, navigate to the refine landing page.
Step 2 - Open the extension popup
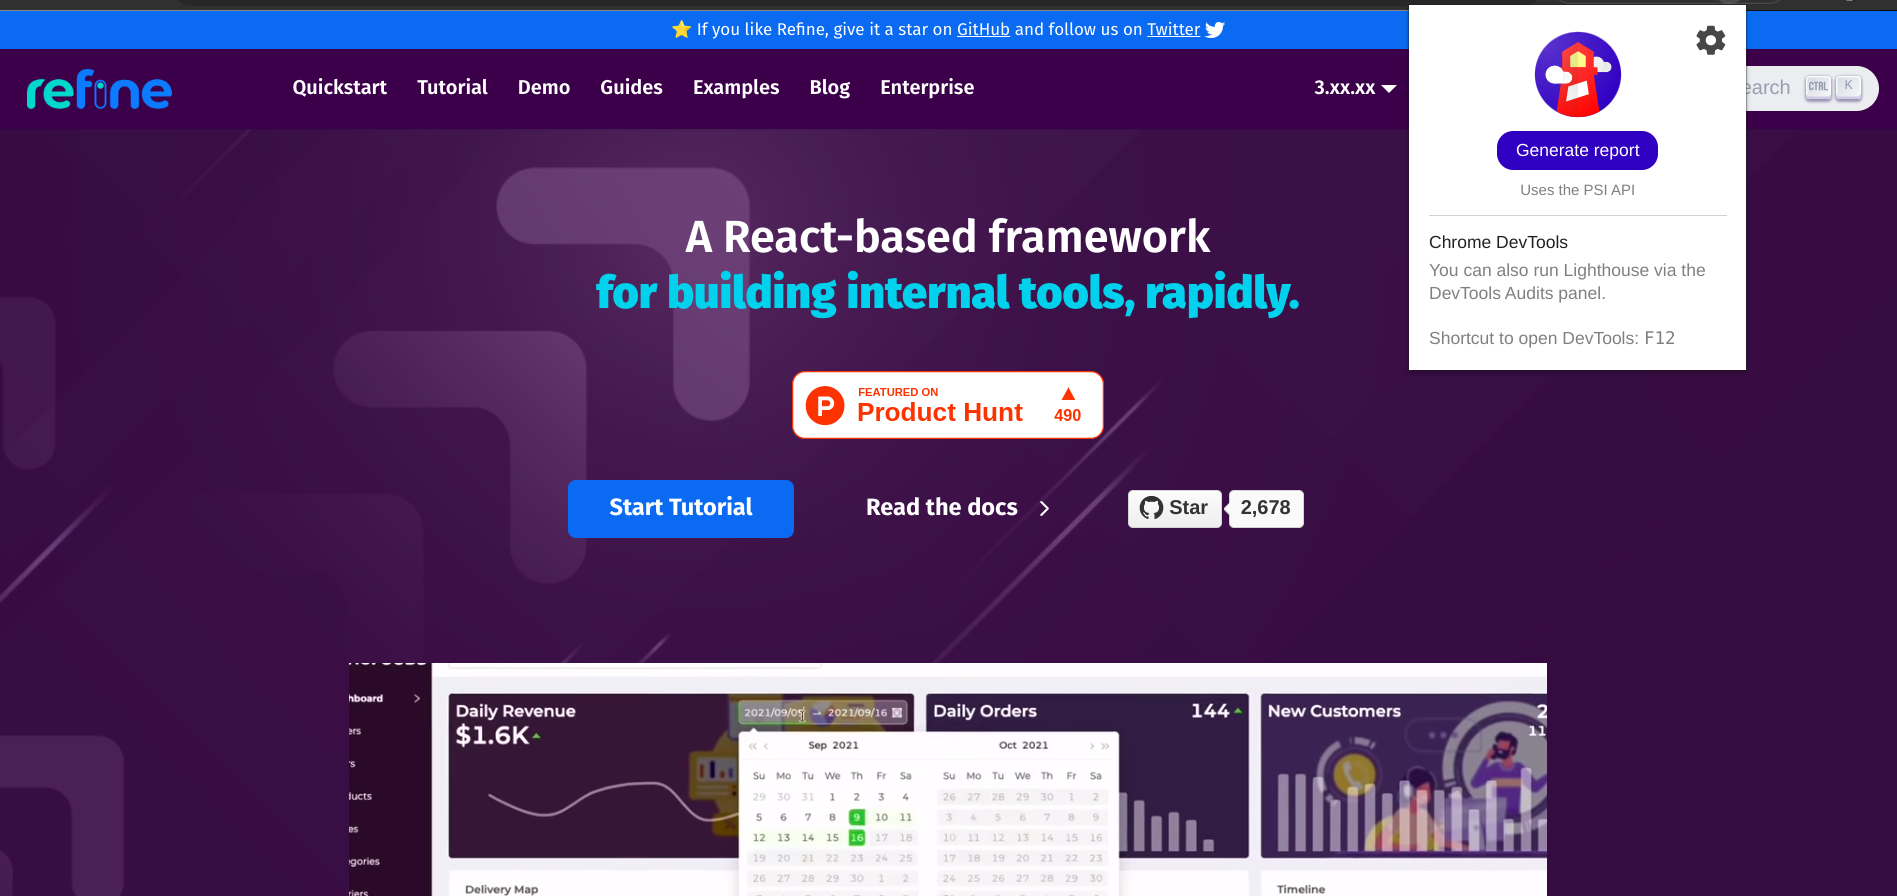
Open the Google lighthouse chrome extension popup by clicking the extension icon in the Chrome toolbar.

Step 3 - Select the categories to audit
As pointed out in the introduction section, you can audit a website for performance, accessibility, best practices, SEO, and PWA. In the extension popup, you can click the gear icon to select the categories to audit and the device to emulate.
Step 4 - Generate report
Finally, click the "Generate Report" button to generate the audit report. The report should be similar to what we got after running Google lighthouse from the Chrome DevTools. You can as well save the data in HTML or JSON format.
How to use Google lighthouse for auditing progressive web apps
As pointed out above, Google lighthouse can audit a website for performance, best practices, accessibility, SEO, and PWA. In addition to being installable, Progressive web apps come with several progressively enhanced features. You can use Google lighthouse to validate whether a site is installable or optimized for PWA.
If you navigate to the refine landing page and use Lighthouse to audit the site for PWA features and best practices, you will get a report similar to the image below. Because refine is not a PWA, most of the tests will fail. Google lighthouse will highlight the failing test and provide a link to documentation that explains the feature.

It is worth mentioning that PWAs have several features and best practices to follow. Google lighthouse can audit only a handful of these features. You need to check some of them manually. Google lighthouse will also hint at the items you need to check manually.
How to view Google lighthouse report
Using Google lighthouse via the Chrome DevTools or the browser extension will generate the report and immediately display it in the browser. Depending on how you use Google lighthouse, you can also save the performance data in HTML or JSON format.
View the report by opening the HTML file in the browser or uploading the data in JSON format to the lighthouse viewer. When using lighthouse viewer, it is possible to save the JSON data in a GitHub gist and use the gist URL instead of uploading the data from a storage device.
How to add Google lighthouse to a CI workflow
If your team uses a continuous integration workflow, you can use the Google lighthouse CI toolset to run Google Lighthouse as part of your workflow. According to the documentation, Google lighthouse CI is a suite of tools that simplify running Google lighthouse scores in your CI workflow.
Lighthouse CI works with CI providers like Circle CI, GitHub actions, and Travis CI. Follow the steps below to learn how to use it with GitHub actions.
Step 1 - Create GitHub Actions workflow directory
Create a .github/workflow directory to store your GitHub workflow files at the root of your project directory to start using GitHub actions.
Step 2 - Create GitHub Actions workflow file
Create a YAML workflow file that will contain the code for running Google lighthouse CI when certain events occur. We will run Google lighthouse CI when either push or pull_request event occurs. Give a descriptive name to the YAML file. I will name it lighthouse.yaml.
Copy and paste the code below into the YAML file you have just created. The code runs whenever you push changes to the Git repository or open a pull request. I am taking the simplest case, where you have an HTML file at the root of the project directory. You can modify the workflow file slightly if your project requires a build step.
name: Run lighthouse CI

on:
  push:
    branches: [main]
  pull_request:
    branches: [main]

jobs:
  lhci:
    name: Lighthouse CI
    runs-on: ubuntu-latest

    strategy:
      matrix:
        node-version: [14.x]

    steps:
      - uses: actions/checkout@v2
      - name: Use Node.js ${{ matrix.node-version }}
        uses: actions/setup-node@v1
        with:
          node-version: ${{ matrix.node-version }}
      - name: Run lighthouse CI
        run: |
          npm install -g @lhci/cli@0.3.x && lhci autorun --upload.target=temporary-public-storage --collect.staticDistDir=./
The above example also assumes you don't have a configuration file at the root of your project directory.
Step 3 - Push the changes to GitHub
The code above will run the Google lighthouse CI when you commit and push the changes to GitHub. Each time someone opens a pull request or pushes a commit, GitHub actions will run the specified command so that you are aware of regressions over time.
GitHub is by no means the only CI provider. You can run Google lighthouse with other CI tools like Circle CI and Travis CI. The Google lighthouse CI documentation explains all the supported CI providers.
Conclusion
You can use Google Lighthouse for auditing a website or application for performance, accessibility, best practices, SEO, and PWA. Depending on your preferences, you can use Chrome DevTools, as a Chrome extension, command line tool, or Node module. Several other Chromium-based browsers like Opera, Edge, and Brave also package Google Lighthouse as part of their DevTools.
On the other hand, it is worth mentioning that Google Lighthouse is just a tool. And a tool is only as good as the user. Striving for the highest Google lighthouse scores is commendable but not sufficient. One fine example where the Google lighthouse usually falls short is the accessibility audit. It is common to have an inaccessible site with a perfect Google lighthouse accessibility score.
Therefore, you must go above and beyond to test your site with actual users even though you have perfect Google lighthouse accessibility scores. We have covered the introduction to Google Lighthouse in this article. Check the documentation for in-depth guides.


